
Lesson Objectives

|
Core Use and understand the advantages of using headers, footers, tables and charts to improve document design Challenge Investigate and select appropriate method to convey information as text, tables or charts Super Challenge Revise an existing document that has data as text and to tabulate or use charts to improve presentation of the information |
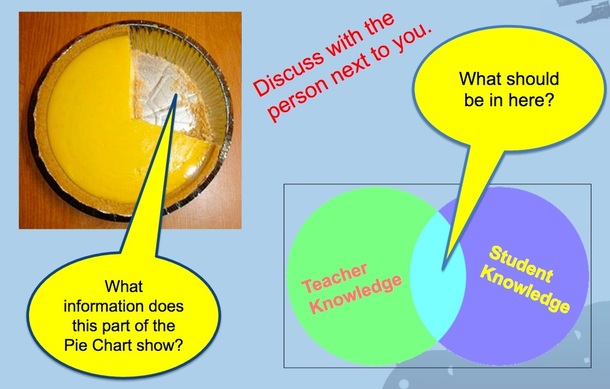
Starter - Work in pairs to work out possible answers to the questions in the image below (5 min):
Classroom presentation
You will have to be in the school domain to see the presentation
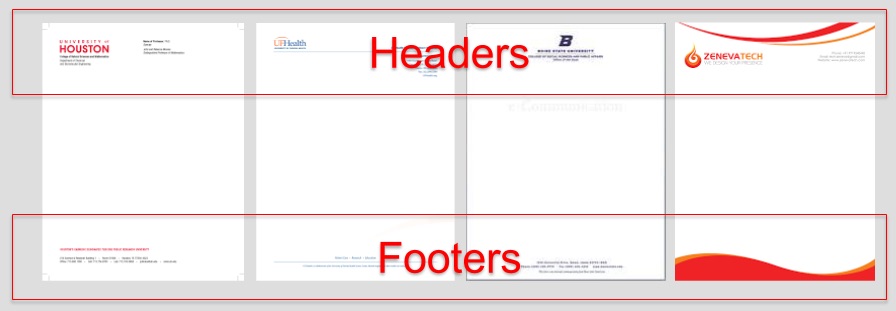
Why would you use a header and a footer in a document design?
- Headers and footers are pieces of text, or graphics, that appear at the top and bottom of a document page.
- They are used by business, schools and other organisations to give documents an identity
- All word processing software will allow you to design a document with a header and footer
- We are going to learn how to add these using Google Docs…
Task 1 - Inserting headers and footers into Google Docs (20 mins)
Open the task 1 document below - Inserting Headers and Footers
Follow the instructions to add a header and a footer into the Google Docs file
Images are in the file for you to add to the header and footer.
An example of a finished document is also available for you to compare with your work.
Follow the instructions to add a header and a footer into the Google Docs file
Images are in the file for you to add to the header and footer.
An example of a finished document is also available for you to compare with your work.
Task 1 - Inserting Headers and Footers

Example of finished document for Task 1.
Adding Charts and Tables into Google Docs
When you wish to present data in a document. If you present the data using a table alone it can be difficult to work out trends in the data. It is usually better to try to present the data in a graphical way. Showing data in a chart is usually easier for the user to appreciate. When data is presented as a chart, then we will be providing information about the data.
Task 2 - Information from Data (2 mins)
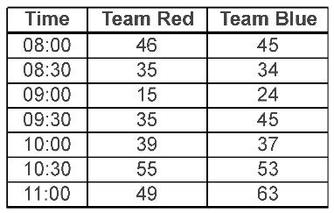
Look at the table below and answer the following two questions. Write your answers in your book.
Task 3 - Assessing Charts
|
1. Which team achieved the highest score in any 30 minute period? 2. Which team scored the most points overall? |
Your teacher will show you the answers to these questions using charts created from this data.
Task 3 - Assessing Charts (25 mins)
With this task you will add charts to a Google Docs file. Attempt the core, challenge and super challenge tasks.
Use the document below (assessing charts) and follow the instructions.
Use the document below (assessing charts) and follow the instructions.
Assessing Charts
Extension Task - in your exercise book
Describe
Describe what you have learned in this lesson.
Strengths
Describe what went well for you in this lesson.
Weaknesses
What could you have done better in this lesson?
Effort
What do you need to look at again to make sure you learn everything?
Describe what you have learned in this lesson.
Strengths
Describe what went well for you in this lesson.
Weaknesses
What could you have done better in this lesson?
Effort
What do you need to look at again to make sure you learn everything?